How to Trade Elliott Wave: A Comprehensive Guide for Beginners

The world of trading can often seem like a chaotic and unpredictable place. However, traders have long been trying to decode market patterns to discover a structured approach to making investment decisions.
One of the most renowned theories in this context is the Elliott Wave Principle. The Elliott Wave Principle offers traders a model for identifying market cycles and predicting future price movement based on investor psychology, sentiment shifts, and other collective factors.
In this comprehensive guide, we’ll explore the Elliott Wave Principle in detail and discuss how it can be applied to trade stocks and Forex effectively. We’ll also walk you through some real-world examples to cement your understanding of this powerful trading tool.
Understanding the Basics of the Elliott Wave Principle
The Elliott Wave Principle is a form of technical analysis that investors use to forecast market trends by identifying extremes in investor psychology and price highs and lows. Ralph Nelson Elliott developed the theory in the late 1930s. He discovered that stock markets do not behave in a chaotic manner, but follow cyclical patterns.
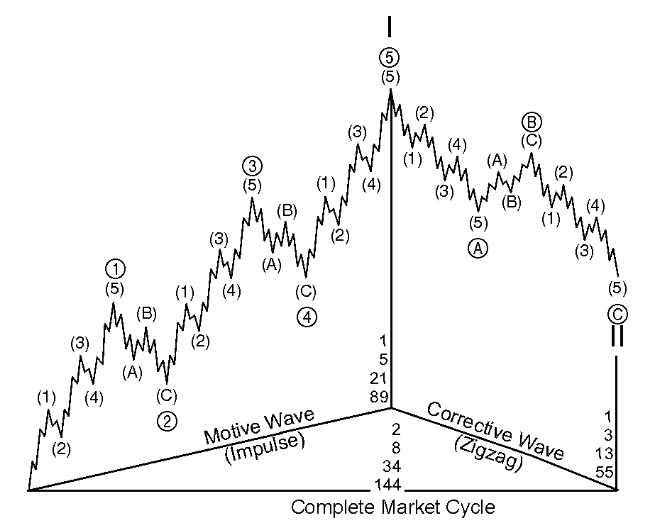
The basic Elliott Wave structure consists of a 5–3 pattern. The first five-wave structure is called the “impulse wave,” and the three-wave structure is termed the “corrective wave.”

Impulse Waves
Wave 1: The first wave is usually a small upward movement.
Wave 2: A corrective downward move, which generally retraces between 50% to 61.8% of Wave 1.
Wave 3: A strong upward move, usually the longest of the five waves.
Wave 4: Another corrective move, smaller than Wave 2.
Wave 5: The final upward move, completing the five-wave impulse sequence.

Corrective Waves
Wave A: A downward move.
Wave B: A retracement of Wave A, but doesn’t surpass the start of Wave A.
Wave C: Another downward move, usually surpassing the end of Wave A.
Identifying Elliott Waves in Stock Markets
Step 1: Start with the Long-Term Chart
Begin by identifying the larger trend in the market. It’s easier to ride the trend than go against it.
Step 2: Spot the Five-Wave Pattern
Look for a five-wave pattern that signifies the larger upward move.
Step 3: Identify the Three-Wave Corrective Phase
After the five-wave pattern, watch for a three-wave corrective pattern.
Step 4: Use Supporting Technical Indicators
Indicators like RSI, MACD, and Fibonacci retracement can help confirm wave patterns.
Real-World Example — Stock Market
Let’s say you’re interested in trading Apple Inc. (AAPL) shares:
1. In a bullish cycle, you identify that the stock has moved from $150 to $200, a significant upward move (Wave 1).
2. It then retraces to $175 (Wave 2).
3. The next upward move takes it to $250 (Wave 3).
4. A minor correction brings it down to $230 (Wave 4).
5. Finally, it moves up again to $270 (Wave 5).
After this, a corrective A-B-C pattern is likely to occur. Knowing this, you could prepare your trading strategies accordingly.
Trading Forex Using the Elliott Wave Principle
The Elliott Wave Principle can also be applied effectively in the Forex market. The main difference is that in Forex, you’re dealing with currency pairs, so you have to consider the economic indicators and geopolitical scenarios affecting both currencies.
Real-World Example — Forex
Let’s consider trading the EUR/USD pair:
1. You notice a significant upward trend from 1.1000 to 1.1500 (Wave 1).
2. A retracement occurs down to 1.1300 (Wave 2).
3. A strong rally takes it to 1.2000 (Wave 3).
4. A correction down to 1.1800 occurs (Wave 4).
5. Finally, it shoots up to 1.2200 (Wave 5).
In this scenario, you would be preparing for a corrective A-B-C pattern next.
Key Points to Consider
1. Risk Management: Always employ strong risk management tactics like setting stop-loss orders.
2. Wave Extensions: Sometimes one of the impulse waves, most commonly Wave 3, will “extend,” or have sub-waves.
3. Complex Corrections: Corrective patterns can sometimes be more complex, taking forms like triangles or zigzags.
Conclusion
The Elliott Wave Principle is not a guaranteed forecasting tool but a highly respected method for understanding the market psychology and sentiment. Understanding its core concepts can provide traders a significant edge in both the stock and Forex markets. Always remember, the key to successful trading lies not just in pattern recognition but also in effective risk management. Happy trading!
